Infographics
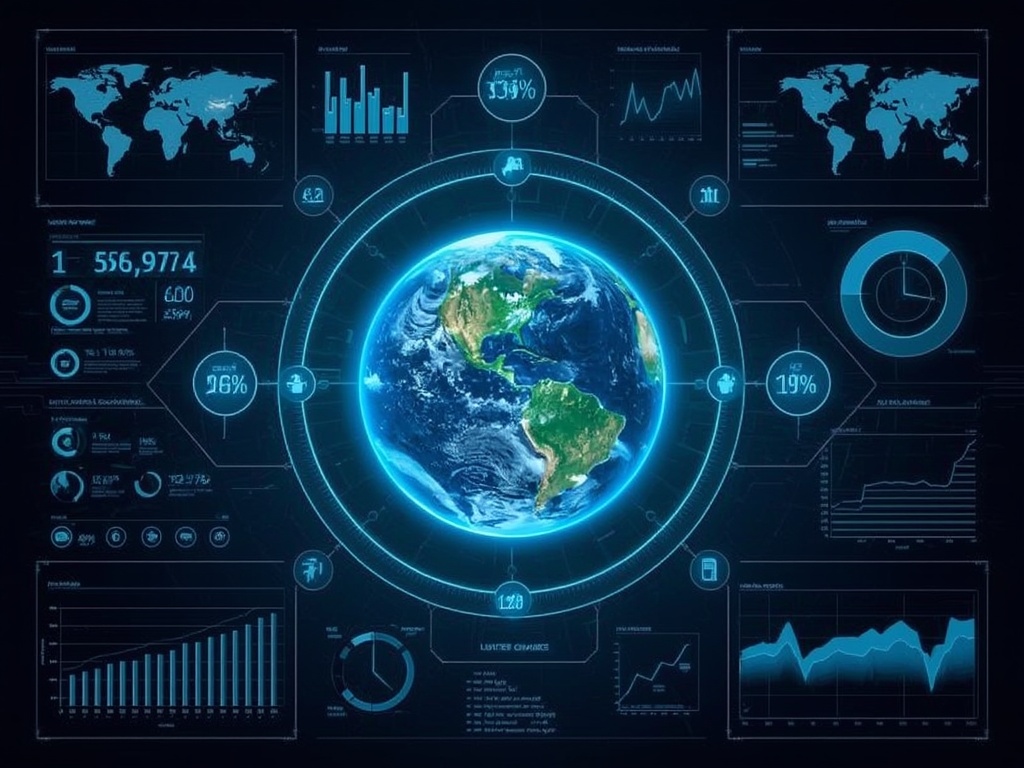
Climate Change Data Visualization Infographic
Discover a stunning AI-generated infographic on climate change, featuring a glowing Earth and dynamic charts. Perfect for presentations, educational materials, and digital content on global warming statistics.
15 viewsMay 11, 2026
#earth#information#aiart#climate-change#minimalist#global-warming#educational#statistics#graphic design#digital art#neon#chart#eco#data visualization#infographic
LA
Lucas Anderson
@lucas.anderson
123 images0 followers
Comments (0)
U
No comments yet. Be the first to say something!
More from Infographics
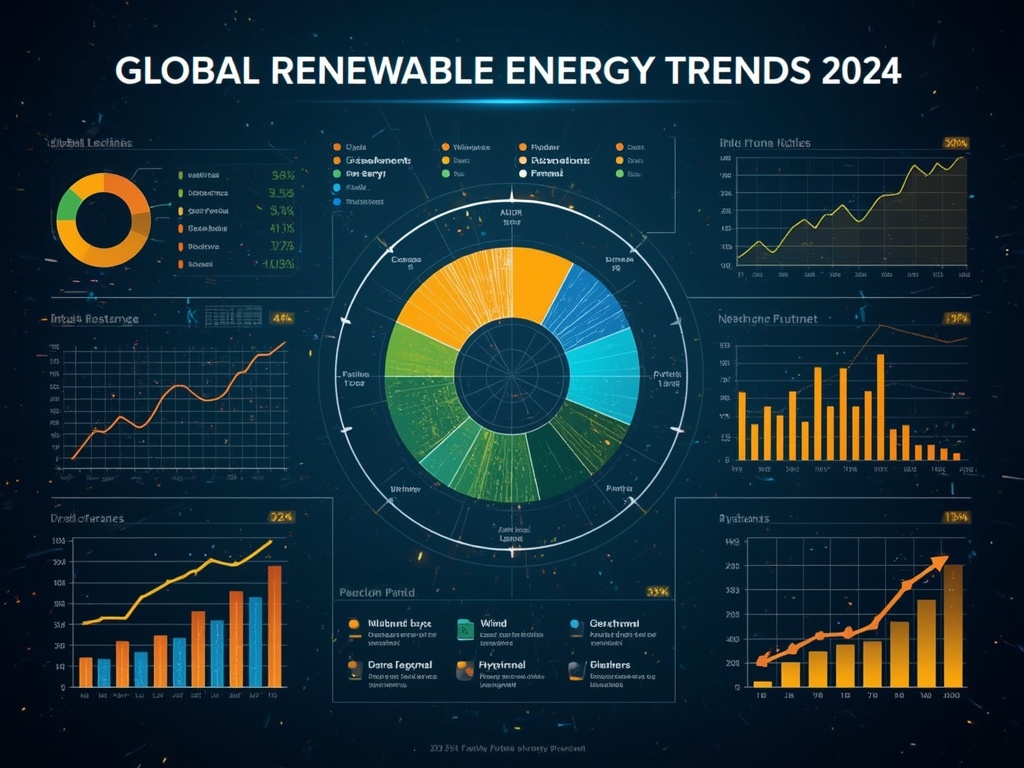
Global Renewable Energy Trends 2024 – Data Visualization Infographic

Infographics Inspiration
Data Flow Insight
Infographics Inspiration
Infographics Inspiration
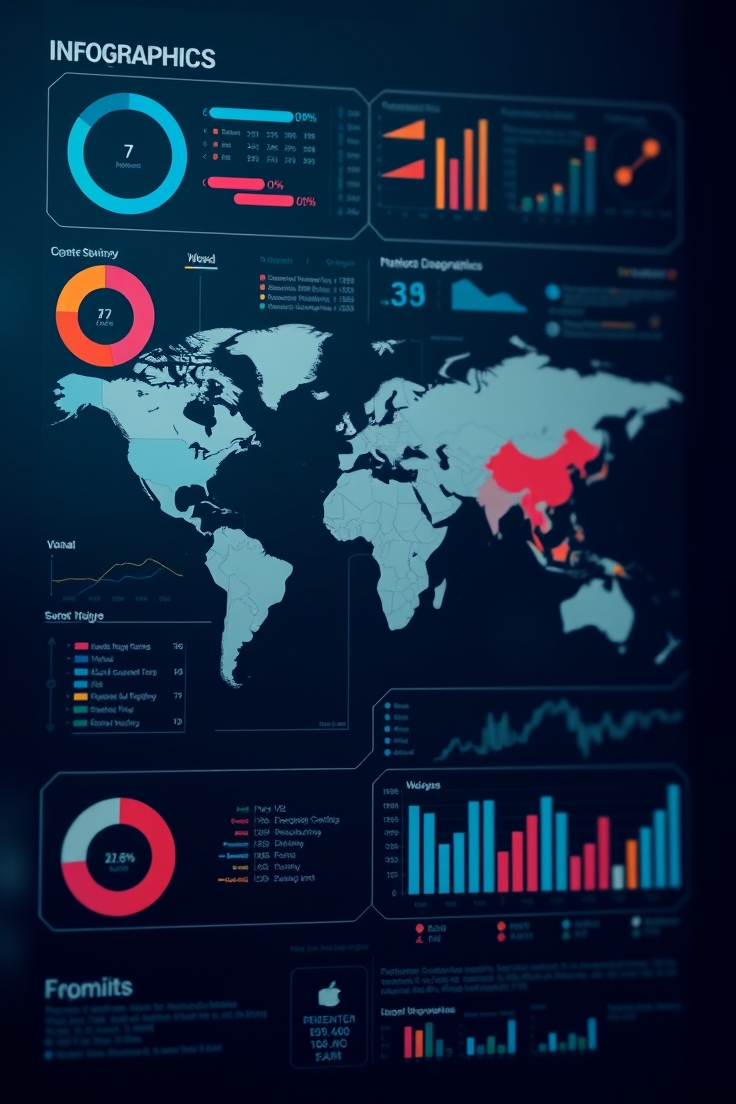
Global Data Nexus: Illuminated Network Infographic
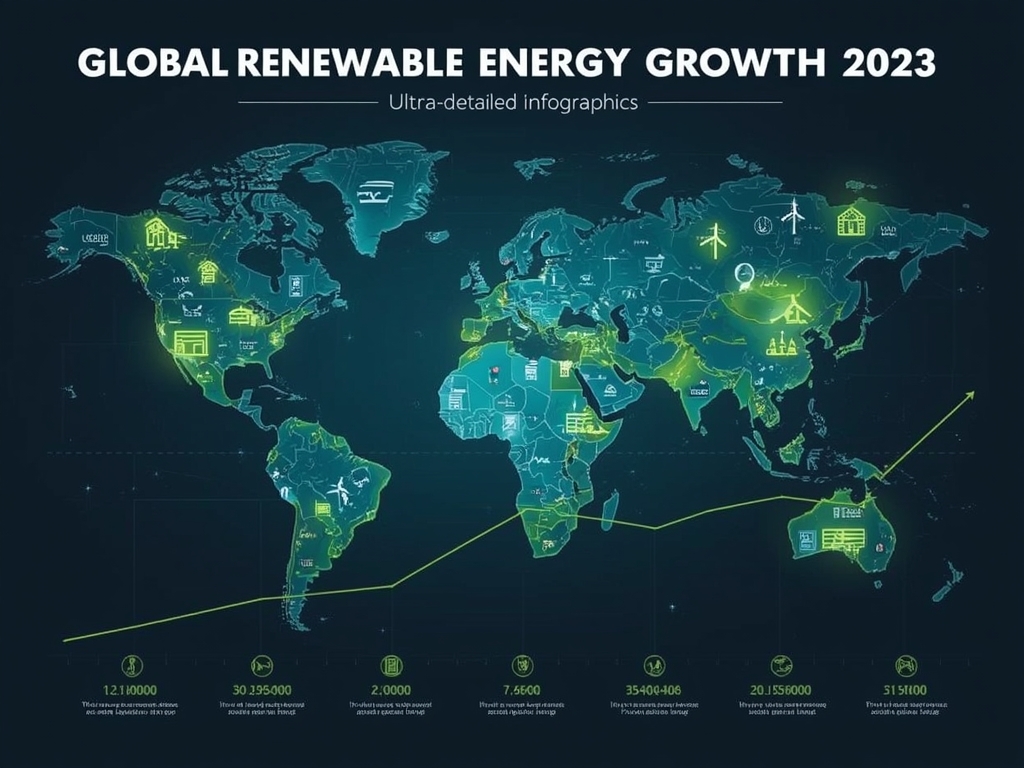
Renewable Energy Growth Visualized: A Clean Infographic

Beautiful Infographics Inspiration

Data Pulse: Futuristic Infographics

Data Tree: Visualizing Growth

Premium Infographics

Neon Data Skyline